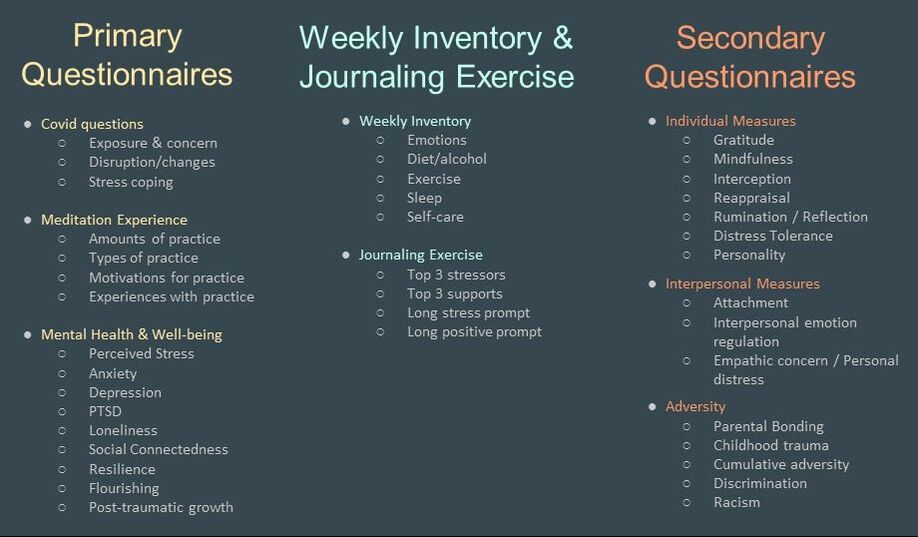
Self-Report MeasuresPrimary QuestionnairesStress Coping (Brief-COPE)
Stress coping was measured with the 28-question Brief-COPE, which is designed to measure a broad range of coping responses to a stressful event, including how individuals confront, react to, and feel about the event (Carver, 1997). This questionnaire includes 14 different coping strategies, each of which is asked about in two different ways. Those strategies are: (1) Self-distraction, (2) Active Coping (3) Denial, (4) Substance Use, (5) Use of Emotional Support, (6) Use of Instrumental Support, (7) Behavioral Disengagement, (8) Venting, (9) Positive Reframing, (10) Planning, (11) Humor, (12) Acceptance, (13) Religion, and (14) Self-blame. Possible scores for each coping strategy range from 2–8, with higher scores indicating greater use of that particular strategy. Perceived Stress Scale (PSS)
Perceived stress was measured with the 10-question Perceived Stress Scale (PSS), which is designed to measure how individuals judge stressful situations in their life (Cohen et al., 1983). These questions are designed to assess how unpredictable, uncontrollable, and overwhelming people find their lives (Cohen & Williamson 1988). Possible scores range from 0–40. Higher scores indicate higher stress levels. Scores of 0–13 indicate low perceived stress, scores of 14–26 indicate moderate perceived stress, and scores of 27–40 indicate high perceived stress. PTSD (PCL-5)
PTSD symptomatology was measured with the 20-question PTSD Checklist (PCL-5), which is designed to measure the 20 symptoms of Post-traumatic Stress disorder described in the Diagnostic and Statistical Manual of Mental Disorders (DSM-5; Blevins, Weathers, Davis, Witte, & Domino, 2015). It is often used to screen individuals for, monitor symptoms of, and make provisional diagnoses of PTSD. In the CCC Study, we administered the civilian PTSD checklist, without reference to a particular traumatic event. Possible total scores range from 0-80. Higher scores indicate greater PTSD symptom severity. Trait Anxiety (STAI-T)
Anxiety was measured with the 20-question trait portion of the State-Trait Anxiety Inventory (STAI-T), which is designed to measures the presence, severity, and likelihood of trait anxiety (Spielberger, Gorsuch, Lushene, Vagg, & Jacobs, 1983). Possible scores range from 20-80, with higher scores indicating greater anxiety. Depression (CES–D)
Depression symptoms were measured with the Center for Epidemiology Studies-Depression (CES-D) scale, which consists of 20 questions designed to measure the symptoms associated with depression, including sleep quality, appetite, and feelings of loneliness among others (Radloff, 1977). Possible scores range from 0-60. Higher scores indicate greater depressive symptoms. Scores over 16 identify individuals at risk for clinical depression, but are not diagnostic. Loneliness (ULS)
Loneliness was measured using the UCLA Loneliness Scale (ULS), which consists of 3 questions designed to measure an individual’s feelings of loneliness (Hughes, Waite, Hawkley, & Cacioppo, 2004). Possible scores range from 3–9. Higher scores indicate greater loneliness. Social Connectedness
Social connection was measured using the Social Connectedness aspect of the Mental Health Statistics Improvement Program (MHSIP) Adult Consumer Satisfaction Survey (Shafer and Ang, 2018), which consists of 4 questions designed to measure an individual’s social connectedness. The presence of “natural supports” such as family, friends, and acquaintances are some factors that gauge social connectedness. Possible scores range from 4-20. Lower scores indicate greater social connectedness. Resilience (CD-RISC)
Resilience was measured using the 10-question Connor-Davidson Resilience Scale (CD-RISC), which is designed to measure psychological resilience (Campbell-Sills & Stein, 2007). Possible scores range from 0–40. Higher scores reflect greater resilience. Posttraumatic Growth (PTGI)
Post-traumatic growth was measured with the 21-question Posttraumatic Growth Inventory (PTGI), which is designed to measure positive outcomes reported by people who have experienced traumatic events (Tedeschi & Calhoun, 1996). Possible total scores range from 0–105, with higher scores indicating greater growth. This questionnaire also includes five subcategories of growth with the following ranges: 1) relating to others (0–35); 2) new possibilities (0–25); 3) personal strength (0–20); 4) spiritual change (0–10); and 5) appreciation of life (0–15). Higher scores indicate greater growth in each domain. Well-being (MHC-SF)
Well-being was measured with the 14-question Mental Health Continuum “short form” (MHC-SF), which is a shorter version of the Mental Health Continuum questionnaire designed to measure 3 aspects of well-being: emotional, social, and psychological (Lamers et al., 2011). The MHC-SF consists of 3 questions about emotional well-being, 5 questions about social well-being, and 6 questions about psychological well-being. Possible total scores range from 0–70. Three subscale scores may also be calculated: emotional well-being (0–15), social well-being (0–25), and psychological well-being (0–30). Higher scores indicate greater well-being. Weekly Inventories and Journaling ExercisesDifferential Emotions Scale (mDES)
The intensity of positive and negative emotional experiences was measured with a modified version of the Differential Emotions Scale (mDES), which typically includes 20 questions designed to measure general mood states (Major et al., 2018). We added 1 additional question to this scale to measure how bored, restless, or sluggish people felt, for a total of 21 items. Possible scores for individual items and possible scores for positive and negative emotions range from 0 to 4. Higher scores indicate feeling a greater degree of those emotions. Impact of Event Scale-Revised (IES-R) The degree of post-traumatic distress participants experienced in relation to the pandemic was measured using the Impact of Event Scale-Revised (IES-R), which includes 22 questions designed to measure subjective distress caused by a traumatic event (Weiss & Marmar, 1997). The scale consists of three subcategories: intrusion, avoidance, and hyperarousal. Possible total scores range from 0–88 and subscale scores range from 0-4. Higher scores indicate greater distress. Eating and Drinking Habits Dietary patterns were measured using an adapted set of questions from the Block Fat/Sugar/Fruit/Vegetable Screener (Block et al., 1986; Lalonde et al., 2008), the Health Promoting Lifestyle Profile II (Walker, Sechrist, & Pender, 1987), and the 2018 National Survey on Drug Use and Health (Substance Abuse and Mental Health Administration, 2019). Topics asked about included the number of servings of different types of foods participants were eating, their frequency of ordering food out versus cooking at home, and alcohol consumption. International Physical Activity Questionnaire-Short Form (IPAQ) Physical activity was measured with a modified version of the International Physical Activity Questionnaire (IPAQ) short form, which includes 7 questions designed to measure physical activity levels over the past week (Craig et al., 2003). The short form assesses four levels of physical activity which include: 1) vigorous-intensity activity, 2) moderate-intensity activity, 3) walking, and 4) sitting. It categorizes individuals into categories of low, moderate, and vigorous activity levels based on the amounts and frequencies of each type of physical activity. The Pittsburgh Sleep Quality Index (PSQI) Sleep was measured using a modified version of the Pittsburgh Sleep Quality Index (PSQI) which is designed to assess sleep quality and disturbances (Buysse, Reynolds, Monk, Berman, & Kupfer, 1989). It typically includes 19 items designed to measure sleep quality, of which we asked 18 items. Scores range from 0–21 with higher scores indicating worse sleep quality. Secondary QuestionnairesHeartland Forgiveness Scale (HFS)
Forgiveness was measured with the Heartland Forgiveness Scale (HFS), which includes 18 questions designed to measure forgiveness of self, others, and situations (Thompson & Synder, 2003). The HFS consists of three subscales: Forgiveness of Self, Forgiveness of Others, and Forgiveness of Situations. Possible total scores range from 18–126 and scores for each of the three subscales range from 6–42. Higher scores indicate higher levels of forgiveness. Experience in Close Relationships - 12 (ECR-12) Attachment was measured with a modified version of the Experiences in Close Relationships-12 (ECR-12) questionnaire (Lafontaine et al., 2015), which includes 12 questions designed to measure adult romantic attachment (Brennan, Clark, & Shaver, 1998). This questionnaire contains two subscales: attachment anxiety and avoidant attachment. Subscale scores range from 1–7. Higher scores indicate greater attachment insecurity. Interpersonal Reactivity Index (IRI) Empathic concern and personal distress were measured using two subscales of the Interpersonal Reactivity Index (IRI; Davis, 1980, 1983). The IRI was designed to measure dispositional empathy and typically consists of four subscales: Perspective Taking, Fantasy, Empathic Concern, and Personal Distress. Subscale scores for the two subscales asked in the CCC study (Empathic Concern and Personal Distress) range from 0–28. Higher scores indicate higher levels of empathic concern and personal distress. Interpersonal Regulation Questionnaire (IRQ) The tendency to pursue interpersonal emotion regulation and the perceived efficacy of interpersonal emotion regulation was measured using the Interpersonal Regulation Questionnaire (IRQ; Williams, Morelli, & Zaki, 2018), which includes 16 questions designed to measure engagement in interpersonal emotion regulation. The IRQ consists of 4 subscales: Negative-Tendency (IRQ-NT), Negative-Efficacy (IRQ-NE), Positive-Tendency (IRQ-PT), and Positive-Efficacy (IRQ-PE). Possible total scores range from 16-112 and subscale scores range from 4-28. Higher scores indicate higher levels of interpersonal emotion regulation. Reappraisal Capability - Emotion Regulation Questionnaire (ERQ) The Reappraisal Capability Emotion Regulation Questionnaire (ERQ; Gross & John, 2003) includes 11 questions designed to measure a person’s tendency to regulate their emotions through cognitive reappraisal (changing the way you think of a situation to help calm an emotional reaction). The original questionnaire consists of questions about Cognitive Reappraisal and Expressive Suppression, but in the CCC study, we only asked about Cognitive Reappraisal. An additional 5 Cognitive Reappraisal questions were developed for our scale as well. Possible scores range from 11-77 with higher scores indicating higher levels of cognitive reappraisal. Rumination-Reflection Questionnaire (RRQ) Rumination and reflection were measured using the Rumination-Reflection Questionnaire (RRQ), which includes 24 questions designed to measure self-attentiveness (Trapnell & Campbell, 1999). The RRQ consists of two subscales: rumination and reflection. In this study, we asked questions about reflection at the baseline and 1-year follow-up assessments. We only asked questions about rumination at the 1-year follow-up assessment. Possible scores for each subscale range from 12–60. Higher scores indicate higher levels of rumination or reflection. Distress Tolerance Scale-Short Form (DTS-SF) The ability to tolerate negative emotional states was measured with the Distress Tolerance Scale-Short Form (DTS-SF), which includes 4 questions to measure an individual’s ability to tolerate negative emotions (Garner et al., 2018). Possible scores range from 4-20. Higher scores indicate higher distress tolerance. Five-Facet Mindfulness Questionnaire (FFMQ) Two aspects of mindfulness were measured with items from the Five Facet Mindfulness Questionnaire (FFMQ): 1) non-reactivity to inner experience, and 2) describing or labeling thoughts and feelings with words (Baer, Smith, Hopkins, Krietemeyer, & Toney, 2006). Possible subscale scores range from 7–35 for nonreactivity and 8–40 for describing. Higher scores indicate lower reactivity or a higher capacity to describe thoughts and feelings. Interoceptive Awareness: Multidimensional Assessment of Interoceptive Awareness Interoception was measured with the Multidimensional Assessment of Interoceptive Awareness (MAIA), which includes 32 questions designed to measure interoception (Mehling et al., 2012). This questionnaire includes 8 subscales:
Big Five Inventory (BFI) Personality was measured using the 30-item form of the Big Five Inventory (BFI), which is used to measure the five personality dimensions of extraversion, openness, agreeableness, negative emotionality, and conscientiousness (Soto & John, 2017). Possible scores for the five subscales of personality dimensions range from 6–42. Higher scores indicate higher levels of extraversion, openness, agreeableness, negative emotionality, and conscientiousness. Gratitude Questionnaire-Six Item Form (GQ-6) Gratitude intensity was measured with the Gratitude Questionnaire-Six Item Form (GQ-6) which includes 6 questions that measure how often individuals feel grateful in their daily lives (McCullough et al., 2002). Possible scores range from 6–42. Higher scores indicate greater gratitude intensity. Life Satisfaction Life satisfaction was measured with 5 questions measuring satisfaction in different domains of life: 1) life in general, 2) life at home, 3) present job or career, 4) physical health, 5) spiritual, religious or meditation practices. Items are averaged to create a life satisfaction score ranging from 1-5, with higher scores indicating greater satisfaction. Self-Compassion Scale (SCS-SF) Self-compassion was measured with the 12-item Self-Compassion Scale Short Form (SCS-SF; Raes, Pommier, Neff, & Van Gucht, 2011). This questionnaire contains six subscales: self-kindness, self-judgment, common humanity, isolation, mindfulness, and over-identification. Items are averaged to make a total mean score ranging from 1-5. Higher scores indicate greater self-compassion. Parental Bonding Instrument (PBI) Parental bonding was measured with the Parental Bonding Instrument (PBI), which includes 25 questions designed to retrospectively assess parental styles by asking adults to respond to items about how they remember their primary caregiver during their first 16 years of life (Parker, Tupling, & Brown, 1979). The PBI contains two subscales: 1) care/warmth and 2) control/overprotection. Two different versions of this scale were given: one at baseline and one at the 4-month follow-up assessment. At baseline, participants responded to statements about their caregiver(s) on a 4-point scale ranging from ‘very unlike’ to ‘very like.’ At baseline, possible total scores range from 0–75, care/warmth subscores range from 0–36, and control/overprotection subscores range from 0–39. At 4-month follow-up, participants responded to these same statements on a 5-point scale ranging from ‘strongly disagree’ to ‘strongly agree.’ At the 4-month follow-up, possible total scores range from 25–125, care subscores range from 12–60, and overprotection subscores range from 13–65. At both timepoints, higher scores on the care/warmth subscale indicate more care, and higher scores on the control/overprotection subscale indicate less controlling behavior or over protection. Higher overall scores indicate higher levels of parental bonding. Childhood Trauma Questionnaire-Short Form (CTQ-SF) Childhood trauma was measured with a modified version of the Childhood Trauma Questionnaire-Short Form (CTQ-SF), which includes 28 questions designed to measure childhood trauma and maltreatment (Bernstein et al., 2003). The CTQ-SF contains five subscales: 1) emotional abuse, 2) physical abuse, 3) sexual abuse, 4) emotional neglect, and 5) physical neglect. Possible total scores range from 25–125, and subscale scores range from 5–25. Higher scores indicate higher levels of maltreatment. Adapted Cumulative Lifetime Adversity Measure Lifetime history of adversity was measured by an adapted version of the Cumulative Lifetime Adversity Measure (CLAM), which includes 62 items that measure exposure to negative life experiences (Seery, Holman, & Silver, 2010) and the option to provide 2 additional experiences not already included. The total number of events is calculated and possible scores range from 0 to 64. Higher scores indicate having experienced more adverse events. Major Experiences of Discrimination Discrimination was measured with the Major Experiences of Discrimination inventory, which includes 6 questions to measure unfair treatment in domains such as employment, education, housing, and interactions with the police (abbreviated version; Sternthal, Slopen, & Williams, 2011). For each question, follow-up questions asked: 1) how many times the respondent experienced a particular event 2) how long ago the most recent instance of those experiences occurred, and 3) to what cause the respondent attributed the unfair treatment (e.g., to gender, ethnicity, age, religion, nationality or immigration status). Multiple scores are calculated for this scale: counts range from 0-6 and indicate how many of the 6 experiences someone has encountered, frequency scores tally the total number of times someone experienced discrimination across all 6 categories, and reason scores range from 0-6 and indicate the number of the 6 discriminatory experiences that someone attributes to that particular reason. The Everyday Discrimination Scale Life discrimination was measured with the Everyday Discrimination Scale, which includes 10 questions to measure exposure to chronic life discrimination (Williams et al., 1997). Each question presents a discriminatory event that can occur in day-to-day life. For each question, follow up questions ask for what reason the respondents attribute these experiences (e.g., to gender, ethnicity, age, weight, religion). When using the frequency-based scoring method, possible scores range from 10 to 60. When using the chronicity-based scoring method, possible scores range from 0 to 2600. Higher scores indicate greater exposure to chronic discrimination throughout life. Racism and Life Experiences Scale (RaLES) Racism-related stress was measured with the Racism and Life Experiences Scale (RaLES), which includes 20 items designed to measure multiple aspects of racism-related stress (S. Harrell, personal communication, 2020). This scale asks how frequently someone has experienced different race-related events, as well as the amount of stress each event caused them. Two scores are obtained: the average frequency of experiencing the situations described and the average amount of stress the experiences caused. Both scores range from 0-4, with higher scores indicating more frequent experiences and higher stress from those experiences. Other Study Materials
|