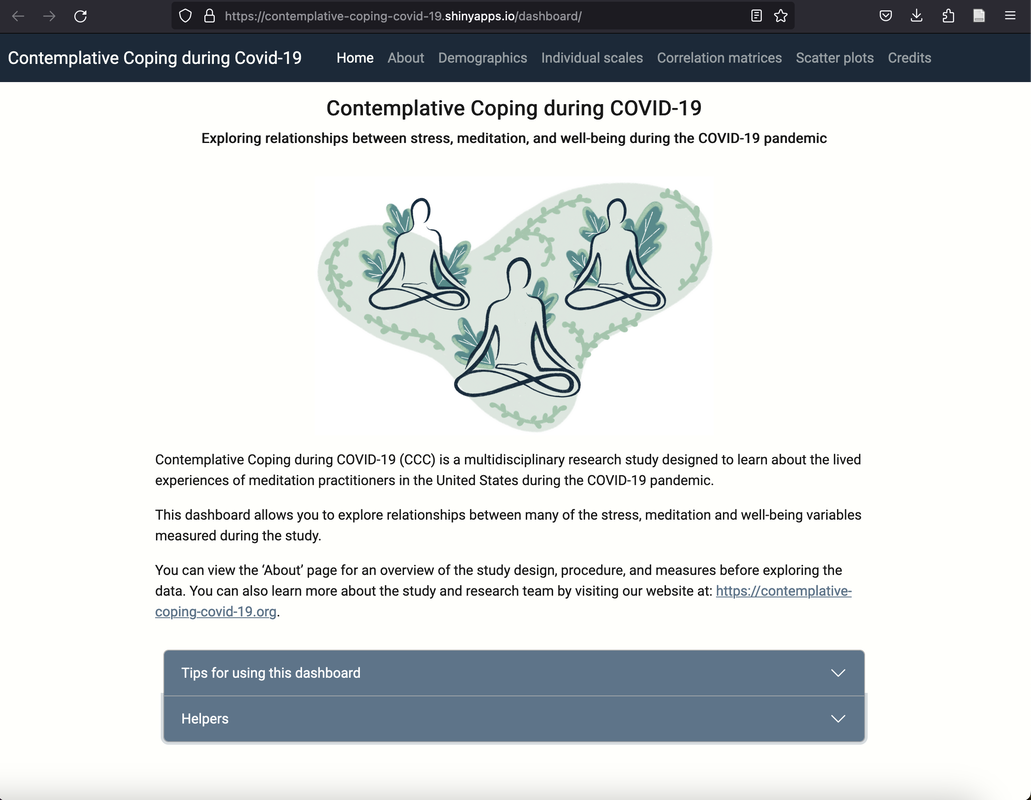
Interactive Data-Visualization Dashboard
|
Dr. Jennifer Pokorny has developed an interactive data-visualization dashboard using the Shiny platform that allows users to explore and visualize relationships between many of the variables we measured. To explore this tool, use the QR code below, or follow this link to visit the data visualization dashboard .
|


